Chart-Er
Chart-Er began as a conversation with Dr. Benjamin Irvine at Bilkent University: could AI become a friendly partner for archaeologists? The result is a tool that transforms CSV uploads into charts with natural-language prompts, showing researchers how automation can support—not replace—their practice.
Under the hood, Chart-Er pairs a no-code UI with a reliable data backbone. FlutterFlow handles the experience, Supabase stores and serves data, n8n orchestrates workflows, Vega Lite generates spec sheets, and OpenAI (GPT-4.1) guides the chart logic. It’s a lightweight proof that AI can make data visualization approachable for any researcher.
- Supabase: database + storage bucket
- FlutterFlow: primary UI/UX
- n8n: self-hosted workflow automation
- Vega Lite: chart spec generation
- OpenAI: GPT-4.1 for NL-to-chart intent

Logo concept for Chart-Er, kept beside the overview.
Sample outputs
Browse representative charts; each slide updates the explanation on the right.
Current slide
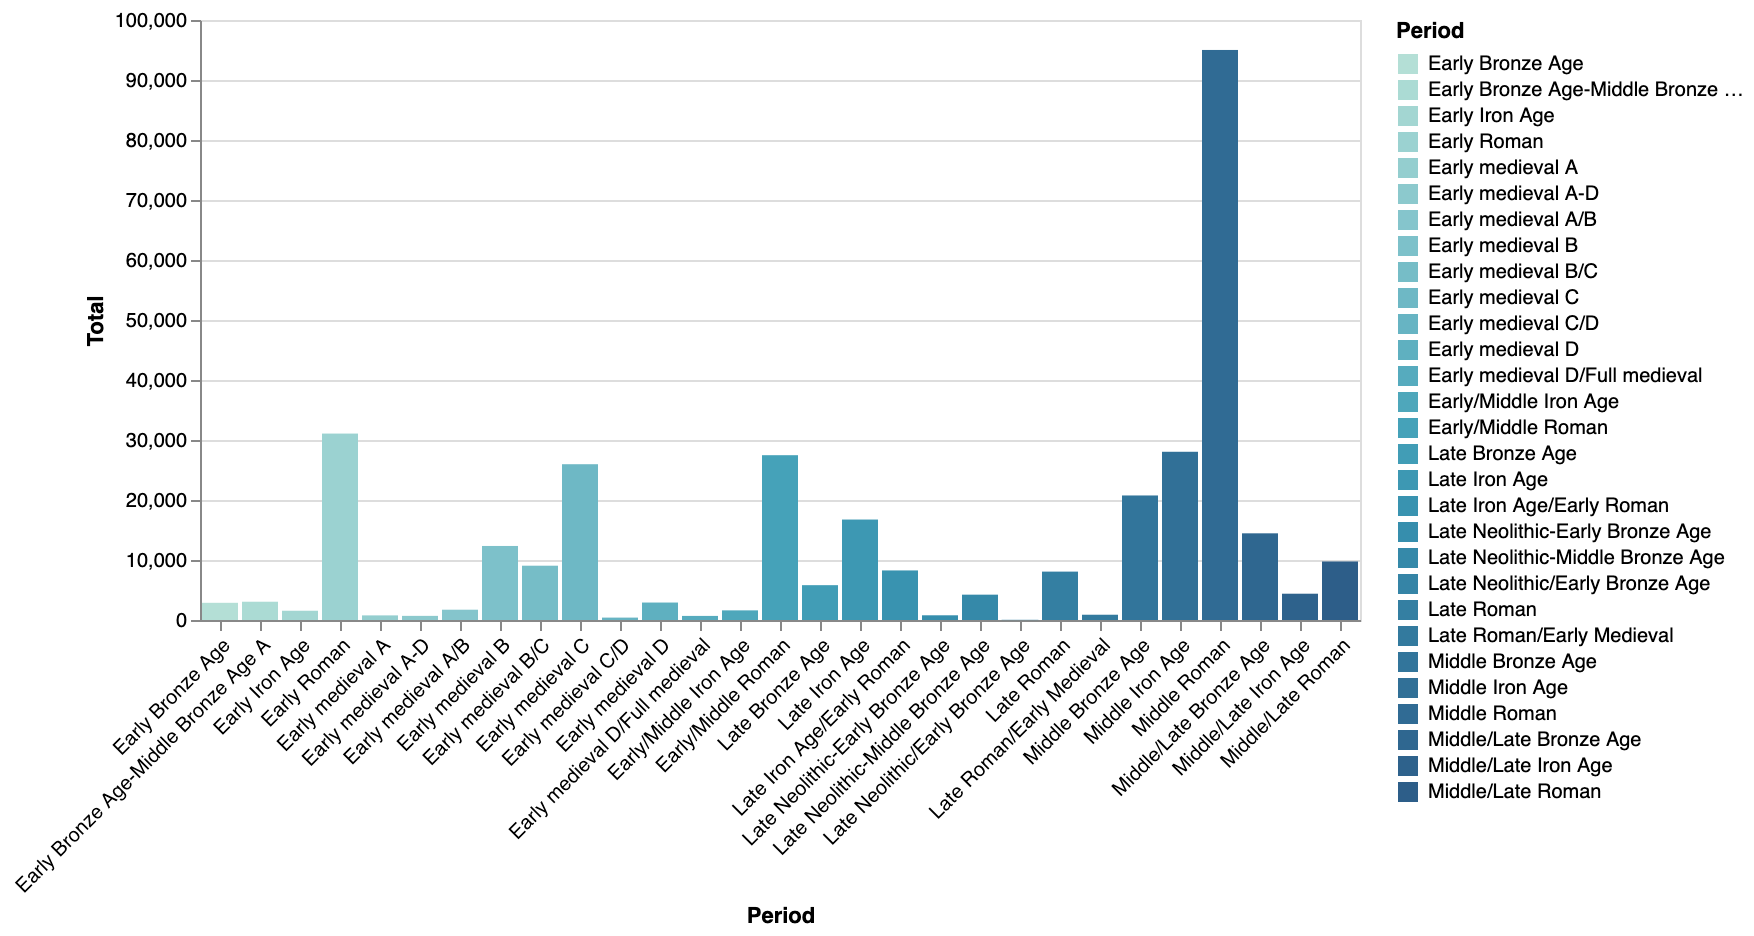
Prompt-driven bar chart
Quick comparison chart generated from a CSV with a short natural-language request, optimized for readability.